

Peptide Purity Testing: Why a 99% COA and a 10 mg Vial Do Not Add Up to 10 mg of Peptide
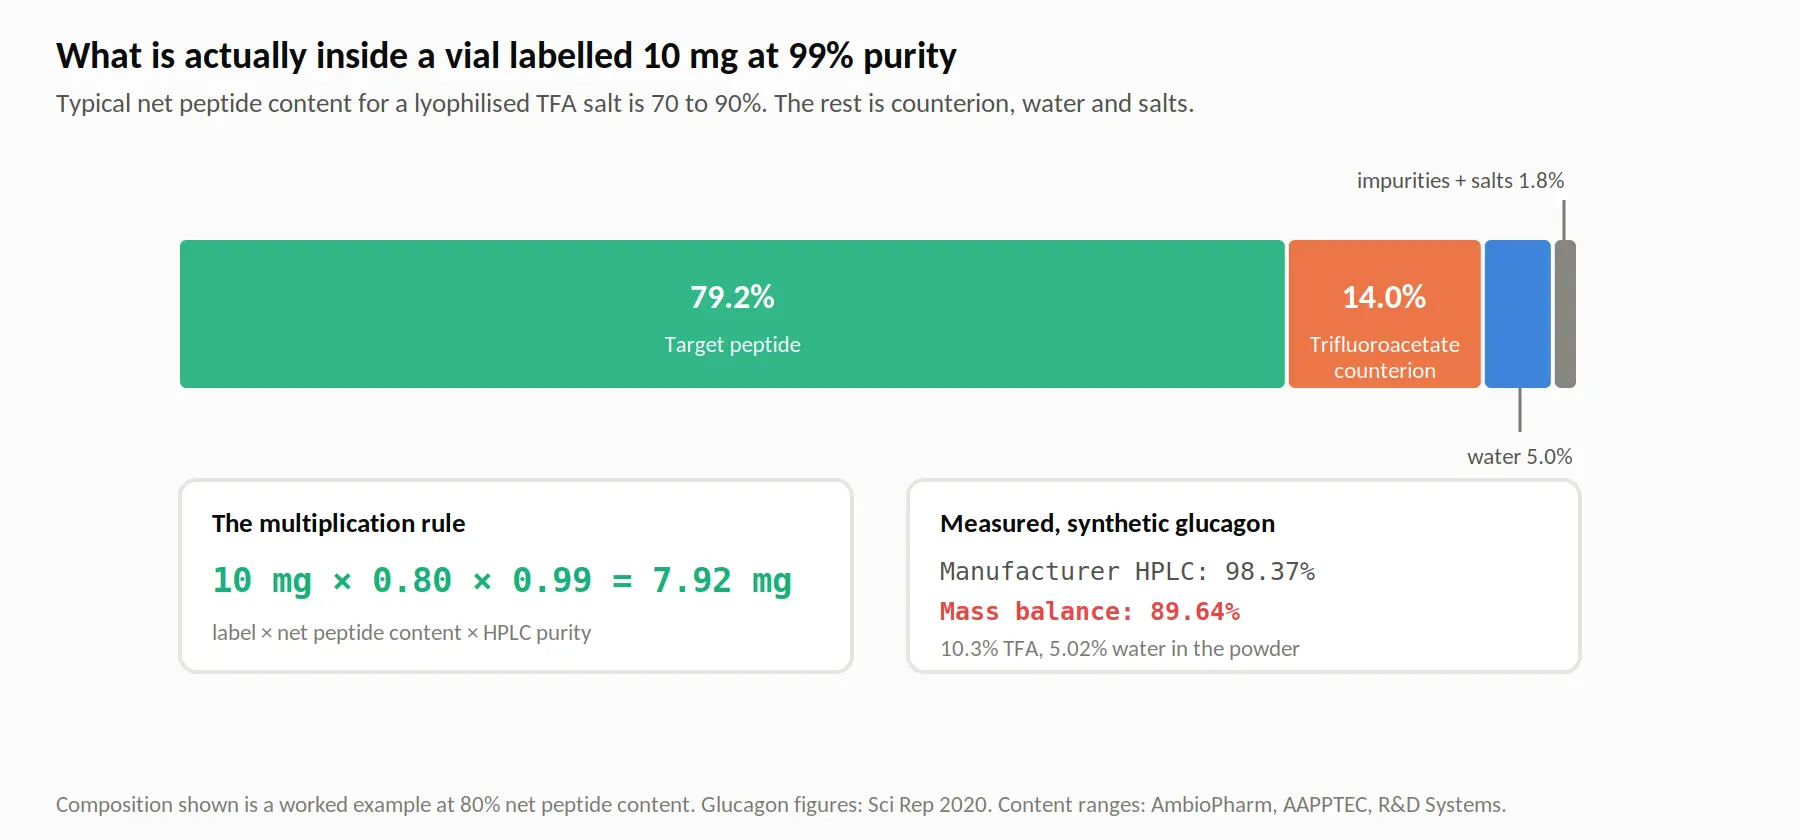
A vial labelled 10 mg at 99% HPLC purity typically contains about 7.9 mg of peptide. Neither number on that label is a lie. They answer different questions, and almost nobody selling peptides explains which is which. Peptide purity testing by HPLC tells you what fraction of the peptide-related material is the peptide you wanted. Net peptide content tells you what fraction of the physical powder is peptide at all. The rest is counterions, residual water and salts, and for a lyophilised trifluoroacetate salt that is routinely 10 to 30% of the mass.
Research-use-only disclaimer: This article covers analytical methods used to characterise synthetic peptides supplied for laboratory research. Research peptides are intended strictly for in-vitro and laboratory research use and are not intended for human or veterinary use. Nothing here is medical advice, and no dosing or administration guidance appears in this article.

TL;DR
Peptide purity testing and net peptide content are two independent measurements, and the amount of peptide in a vial is their product. Typical net peptide content for a lyophilised TFA salt is 70 to 90%, which is why a 10 mg vial at 99% purity holds about 7.9 mg of peptide. HPLC quantifies but cannot identify; mass spectrometry identifies but cannot quantify, and neither sees the counterions or the water. At 214 nm a tryptophan residue absorbs roughly 30 times more strongly than a peptide bond, so area percent is not mole percent. Residual trifluoroacetate is biologically active at 10 to 100 nM. The impurities most likely to matter, D-epimers, aspartimides and deamidation, produce mass shifts of zero, zero and 0.98 Da, so a nominal-mass certificate cannot see them. A certificate is a snapshot dated to the day of analysis. Research use only.
Two numbers: Purity and content are independent. Typical net peptide content is 70 to 90%. A 99% purity figure says nothing about it.
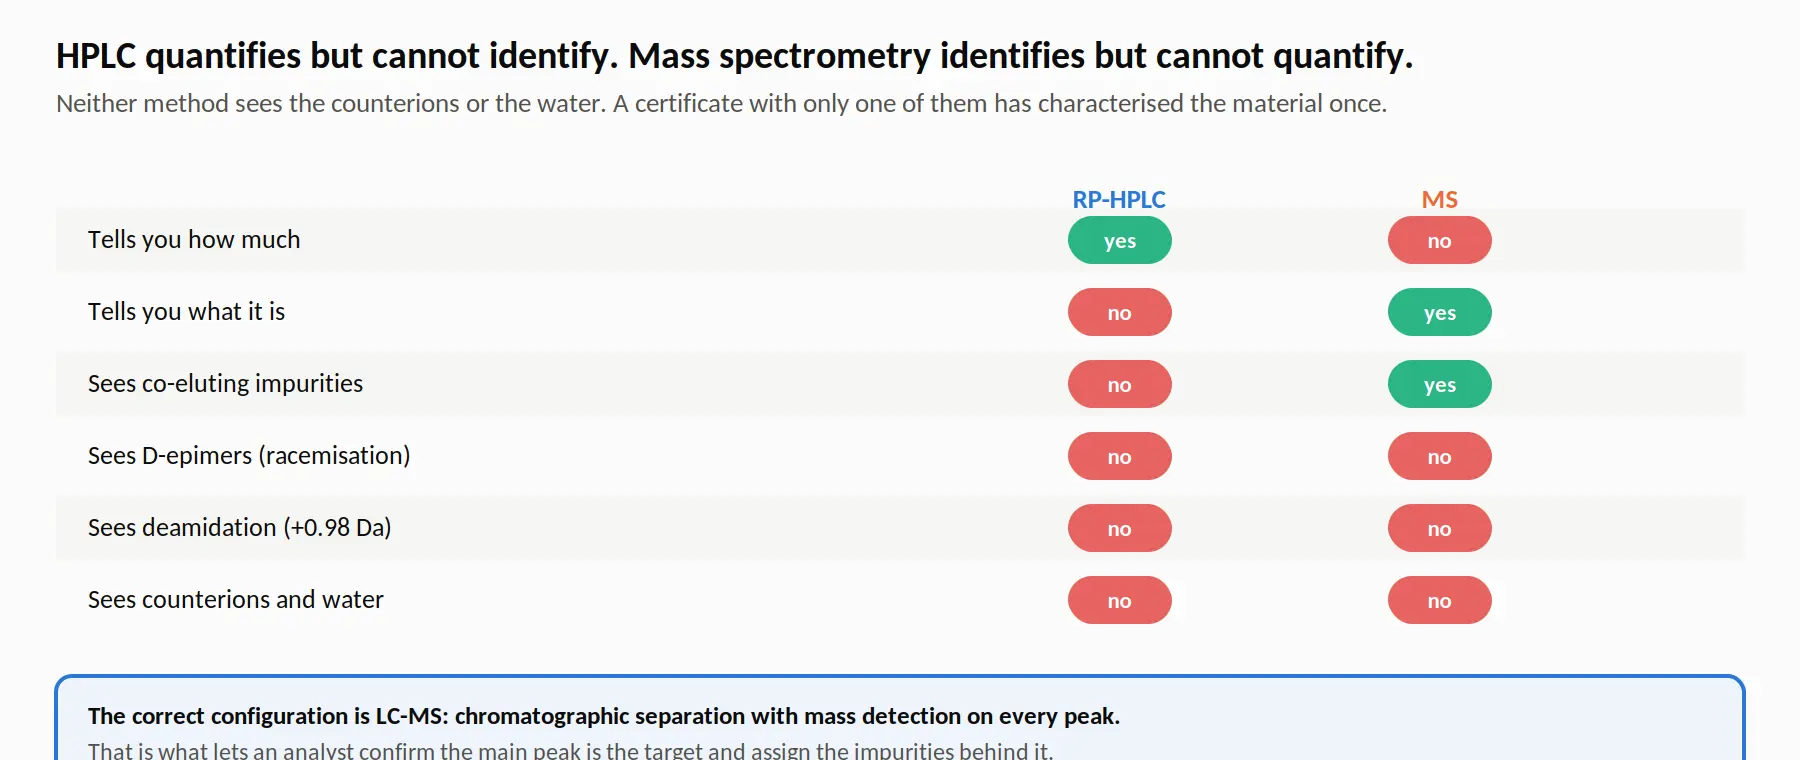
Two methods: HPLC quantifies but cannot identify. Mass spectrometry identifies but cannot quantify. A certificate with only one has characterised the material once.
Area percent: At 214 nm tryptophan absorbs about 30 times more than a peptide bond. Trp-containing impurities are over-counted; deletions that lost the Trp are under-counted.
TFA: Trifluoroacetate at 10 to 100 nM suppressed osteoblast proliferation, and the authors flagged relevance above 1 nM in any cell type.
Invisible impurities: D-epimers are exactly isobaric. Deamidation adds 0.98 Da. Both pass a nominal-mass identity check.
Dated snapshot: Oxidation, hydrolysis, deamidation and disulfide exchange continue after the analysis. An undated certificate has no interpretable purity value.
Status: research use only.
Purity and Content Are Two Different Numbers
HPLC purity is the proportion of peptide-related material that is the target peptide. Net peptide content is the proportion of the physical mass in the vial that is peptide at all. Sigma-Aldrich states the arithmetic plainly: "The absolute amount of correct peptide in a sample is the product of the peptide content and the peptide purity."[1] At a typical 80% net peptide content, 10 mg multiplied by 0.80 multiplied by 0.99 is 7.92 mg.
That gap is not fraud and it is not a supplier cutting corners. It is the default condition of a peptide purified by the standard method, and the reason most researchers never encounter it is that research-grade certificates of analysis do not report net peptide content. AmbioPharm's own documentation says that on a non-GMP certificate, peptide content, water content and counterion content are optional add-ons available on request.[2] The default certificate omits precisely the numbers that determine how much peptide is in the vial.
Sigma-Aldrich defines HPLC purity as "the amount of correct peptide relative to all analytes that absorb at 214 nm," and states that this measurement "does not account for water and salts in the sample."[1] Bachem defines net peptide content as "the percentage of peptides relative to non-peptidic material (mostly counterions and moisture)."[3] AAPPTEC puts the relationship without hedging: "Peptide content is not an indication of peptide purity; these are two independent measurements."[4]
What the typical range is
| Source | Stated net peptide content range |
|---|---|
| AmbioPharm | "typical peptide content levels are between 70 and 90%" |
| AAPPTEC | "may vary, from 50-90 percent, depending on the purity, sequence and method of synthesis and purification" |
| R&D Systems | "although the purity of a particular peptide may be quoted as that of 98%, the net peptide content may only be 70%" |
R&D Systems also documents the compensation practice that a careful supplier follows: for a peptide at 70% net content, ordering 1 mg means dispensing 1.43 mg of physical material, because 1 divided by 0.70 is 1.43.[5] A supplier that does not do this is shipping a systematically underfilled vial, and doing it without disclosing net peptide content means the buyer cannot tell which practice they are getting.
Where the missing mass goes
Trifluoroacetic acid has a molecular weight of 114.02, and it binds every basic site: arginine, lysine and histidine side chains, plus the free N-terminus.
AAPPTEC works a theoretical case. A peptide of molecular weight 1000 with one arginine and a free N-terminus has two basic sites. That gives 1000 divided by (1000 + 2 × 114), which is about 81% theoretical net peptide content, before any water is counted.[4]
This matters more than a single number suggests, because it is sequence-dependent. Arginine-rich peptides bind more counterion and are more hygroscopic, which drives content down and water up.[6] You cannot assume a constant net peptide content across a supplier's catalogue, and a supplier quoting one figure for every product is quoting a convention rather than a measurement.
How net peptide content is measured
EMA's guideline on synthetic peptides specifies the accepted methods: "Assay/content; e.g. by LC, elemental analysis, amino acid analysis, nitrogen analysis by Kjeldahl, or qNMR." It adds a detail worth noticing: "Limits of assays determined by LC are expressed in terms of the counter-ion free, anhydrous substance."[7]
Amino acid analysis is the reference method. Strong acid breaks the peptide into its constituent amino acids, which are separated chromatographically and quantified. Typical conditions are 6N HCl at 150 °C for 1.5 hours under argon with 2% phenol, or 6N HCl at 100 °C for 22 hours, with OPA or FMOC derivatisation and reversed-phase separation.[8] Nitrogen determination by Kjeldahl, or general elemental analysis, gives peptide content from nitrogen content. UV quantitation works only for peptides containing tryptophan or tyrosine with a known extinction coefficient.
The peer-reviewed demonstration, using an honest supplier
A 2020 Scientific Reports study determined synthetic glucagon purity by mass balance rather than by chromatography, measuring every component of the powder separately.[9]
| Measurement | Result |
|---|---|
| Water content | 50.2 mg/g (5.02%) |
| TFA content | 103.03 mg/g (10.3%) |
| Peptide impurities | 0.0112 mg/g |
| Manufacturer-reported purity | 983.72 mg/g (98.37%) |
| LC-UV purity | above 970 mg/g (above 97%) |
| Mass balance content | 896.36 mg/g (89.64%) |
The authors' conclusion: "the result obtained by determining the content of only the main constituent and not the sample impurities using LC-UV is not accurate because some impurities do not absorb ultraviolet radiation."
This is the cleanest illustration available because no misconduct is involved. A legitimate manufacturer ran a legitimate HPLC method and reported a legitimate number, and that number overstated deliverable peptide by about 8.7 percentage points. The gap is structural, not ethical.
One note on that paper. The published equation applied to its own published inputs does not reconcile with the reported result, and there is an unexplained discrepancy of roughly 50 mg/g. I am citing the headline comparison and not the worked arithmetic.
What an HPLC Purity Number Actually Measures
An HPLC purity figure is the area of the main peak divided by the total area of all peaks in a chromatogram recorded at one wavelength. It measures how much of what absorbed light at that wavelength eluted where the target elutes. It does not measure identity, counterions or water, and the number changes with the method that produced it.
Reversed-phase HPLC separates peptides by hydrophobicity on a non-polar stationary phase, usually C18, eluted with an increasing organic gradient. Waters specifies the standard configuration: C18 bonded phase, 130 or 300 Å pore size, 3.5, 5 or 10 µm particles, water as the weak solvent, acetonitrile as the strong solvent, 0.1% TFA as modifier.[10]
Acetonitrile is chosen over methanol or ethanol because it is transparent in the 185 to 205 nm region, which is what makes low-wavelength detection possible at all. Larger 300 Å pores are used for longer peptides so the analyte can reach the internal surface area.
The TFA in the mobile phase is doing two jobs: it "protonates acidic peptide side chains, and ion pairing neutralizes basic side chains, inhibiting their binding to free silanols which cause peak tailing."[10] Hold onto that, because it is the direct reason the finished product is a TFA salt.
Why 214 nm
214 and 220 nm target the amide bond itself, not the side chains. That makes detection close to universal across peptides, whereas 280 nm detects only tryptophan, tyrosine and phenylalanine, and a peptide without them is invisible at 280.
Kuipers and Gruppen measured the contributions directly. At 214 nm the peptide bond has a molar extinction coefficient of 923 M-1cm-1, and side chains contribute relative to that baseline:[11]
| Residue | Absorbance at 214 nm relative to one peptide bond |
|---|---|
| Tryptophan | ~30× |
| Phenylalanine, tyrosine, histidine | ~6× |
| Proline (in chain) | ~3× |
| Methionine | ~1× |
| Others | much lower |
Bachem states the operative convention: purity is "the area of the main peak in relation to the total area of all peaks" at 210 to 220 nm.[3]
The thing that breaks area percent
Because side-chain contributions differ by up to 30-fold, area percent is not mole percent. The calculation silently assumes every species in the sample has the same response factor, and for peptides that assumption is wrong in a specific and predictable direction.
A tryptophan-containing impurity is over-represented, so the purity figure understates quality. A deletion sequence that dropped the tryptophan is under-represented, so the purity figure overstates it. For a peptide containing Trp, the impurity most likely to matter is exactly the one the method is least likely to see.
What must be on the certificate for the number to mean anything
A purity claim is uninterpretable without the method that produced it, because each parameter changes the result.
| Parameter | Why it changes the number |
|---|---|
| Column chemistry, dimensions, particle and pore size | Determines what separates from what |
| Mobile phase, modifier and concentration | Changes retention and peak shape |
| Gradient program (percent B at start and end, time) | A gradient that ends early never sees late-eluting hydrophobic impurities |
| Flow rate and column temperature | Shift retention and resolution |
| Detection wavelength | 214, 220 and 280 nm give different numbers from the same sample |
| The chromatogram image | Shows baseline placement, shoulders and whether the run was long enough |
| Retention time of the main peak and run duration | Lets you check the gradient actually covered the elution window |
| Quantification limit | Separates a real 0.8% impurity burden from integration noise |
EMA requires a quantification limit of 0.1% for LC purity testing.[7] A certificate reporting 99.2% with no stated quantification limit cannot distinguish a real 0.8% impurity burden from integration noise.
Run length deserves its own sentence. A gradient that ends before late-eluting hydrophobic impurities come off the column will report high purity by never seeing them. This is why the full gradient program matters, and not the wavelength alone.
What HPLC with UV detection cannot do
BioPharm International states three hard limits.[12] Co-elution: "If analytes elute with the same or similar retention times, it is not possible to reliably distinguish and identify them by UV detection alone." Identity: "Unknown impurities cannot be identified solely with UV detection." Blind spots: some analytes "have poor UV absorption and are not reliably detected by this technique."
For peptides specifically, co-elution is not a theoretical risk. The impurities are near-isomers of the target. FDA states it directly: "peptide-related impurities are typically similar in structure to the target peptide and may be difficult to identify and quantify without sophisticated analytical methods."[13] A single-residue deletion, a D-epimer or a deamidated variant differs from the target by a fraction of a hydrophobicity unit and can sit underneath the main peak.
This is why regulators require orthogonality. EMA: "Use of at least two orthogonal methods is recommended."[7] PolyPeptide recommends orthogonal separation mechanisms, for example reversed-phase complemented by ion exchange or HILIC.[14]
Mass Spectrometry Confirms Identity, Not Purity
Mass spectrometry measures mass-to-charge ratio and establishes molecular weight, which establishes identity. It does not measure how much of the sample is that molecule. EMA and FDA both list mass spectrometry among identity methods, alongside relative retention time, peptide mapping, amino acid analysis and NMR.
Reading an electrospray spectrum
Electrospray produces a distribution of protonation states rather than one peak. "An ESI mass spectrum is characterized by a number of signals that each differ by one charge." Peptides under denaturing conditions typically show (M+2H)2+ through (M+5H)5+ at m/z 300 to 1500.[15]
Deconvolution converts that ladder back to a single neutral mass. For two adjacent charge states at m/z x1 and x2, the charge is z = (x2 · mH)/(x1 − x2), and every adjacent pair yields the same answer.
There is a practical consequence for reading certificates. A certificate showing the raw multiply-charged spectrum is showing you more than one showing a single deconvoluted number, because you can check the charge-state series for internal consistency yourself. A deconvoluted number alone asks you to trust the software.
MALDI-TOF produces predominantly singly charged ions, mainly (M+H)+, which makes interpretation simpler when more than one species is present.
How tight a mass match should be
| Technique | Achievable mass accuracy |
|---|---|
| MALDI with delayed extraction, peptides 1 to 5 kDa | 10 to 50 ppm |
| MALDI, internal calibration with two peptides | below 6 ppm |
| Nano-ESI orthogonal-acceleration TOF | better than 10 ppm |
| FTICR, internal calibration | better than 3 ppm |
PolyPeptide's practical acceptance criterion is an observed mass within ±1.0 mass units of theoretical.[14] A certificate reporting a 5 Da discrepancy without explanation is reporting a different molecule.
Monoisotopic against average mass
This is a real source of apparent certificate mismatches and it is easy to miss. Monoisotopic mass uses the exact most-abundant isotopes. Average mass uses abundance-weighted element masses. Below about 1500 u the monoisotopic mass is the most abundant peak, but the gap grows with molecular size.
A certificate comparing an observed monoisotopic mass against a theoretical average mass will show a spurious offset. Good certificates state which convention they are using. Most do not.
Three reasons a correct mass is compatible with a bad product
First, mass spectrometry is not quantitative without calibration. Signal strength varies with the ionisation efficiency of each analyte, which is why "UV detection is preferred for quantification, where possible."[12] Ion abundance is not mole fraction.
Second, isobaric impurities share the target's mass exactly. Racemisation produces a D-epimer with identical mass. Deamidation adds 0.98 Da. Neither is resolved by a nominal-mass identity check.
Third, counterions and water are invisible to mass spectrometry. The 10.3% TFA and 5.02% water in the glucagon sample above contribute nothing to the peptide's m/z.
TFA, and the 10 to 30 Percent of the Vial Nobody Discusses
Trifluoroacetate is in the vial because the manufacturing process puts it there twice, and it stays there because removing it costs extra. In measured samples it accounts for 10% of powder mass in peer-reviewed work and up to 55% in one commercial lot. It is also biologically active at concentrations below those at which most peptides are assayed.
Why it is there
First, in Fmoc solid-phase synthesis, TFA performs global side-chain deprotection and cleaves the peptide from the resin. Second, in reversed-phase purification, TFA is the mobile phase modifier.[16] As Cornish and colleagues put it, "Peptides purified by HPLC are often in the form of a trifluoroacetate (TFA) salt, because trifluoroacetic acid is used as a solvent in reversed-phase HPLC separation."[17]
TFA salt is not a choice anyone made. It is what the process leaves behind.
GenScript notes that TFA binds even without basic residues: peptides lacking arginine, histidine and lysine, or carrying blocked N-termini, "require TFA for protonation and hence, are obtained as TFA salts."[18]
How much
| Source | Residual TFA |
|---|---|
| Measured, synthetic glucagon, peer-reviewed | 10.3% of powder mass |
| GenScript standard TFA exchange | 10% to 45% |
| GenScript guaranteed TFA exchange | below 1% |
| Two commercial lots of the same MOG peptide | 55% against 18% |
That last row is the most useful data point in this section. Two suppliers' versions of the same peptide differed threefold in counterion load. Those vendor figures come from GenScript rather than peer review, and I am attributing them accordingly. The peer-reviewed anchor is the 10.3% glucagon measurement.
What it does in an assay
Cornish and colleagues tested trifluoroacetate directly on osteoblast and chondrocyte cultures.[17] TFA at 10-8 to 10-7 M, meaning 10 to 100 nM, "reduced cell numbers and thymidine incorporation" at 24 hours. The authors generalised: the findings are "likely to be relevant to all studies of purified peptides in concentrations above 10-9 M in whatever cell or tissue type." Their recommendation was that peptides "should be converted to a hydrochloride or biologically equivalent salt before assessment of their biological effects is undertaken."
Work through what that threshold means. A peptide assayed at 100 nM carrying two equivalents of TFA delivers roughly 200 nM trifluoroacetate, which sits inside the range Cornish reported as inhibitory. The confound is the default condition of an untreated TFA-salt peptide in cell culture, not an edge case.
It does not run in one direction either, which is worse. TFA stimulates murine glioma cells at 0.5 to 7.0 mM.[18] TFA is not uniformly inhibitory. It is uniformly confounding.
Two other documented interferences. In an experimental autoimmune encephalomyelitis model, a MOG peptide with higher TFA content produced "a more rapid appearance of symptoms" than the lower-TFA preparation, so counterion load acted as an uncontrolled variable in a disease model. And in FTIR structural work, TFA produces a strong band around 1670 cm-1, which overlaps the amide I region used to assign secondary structure.[18]
Salt exchange
Acetate is the standard alternative, and it is the salt form of most approved peptide drugs. Dissolving in 10 to 100 mM HCl for about a minute and re-lyophilising works: "10 mM HCl was sufficient to reduce TFA below the Limit of Quantification."[16] Commercial exchange to hydrochloride, formate, acetate or phosphate reaches below 1% residual TFA.
EMA's position: "The type of counter ion should be defined, and the amount of counter ions should be controlled in the active substance specification with a justified upper limit."[7] Measurement is by ion chromatography, or by 19F NMR with a practical limit of detection around 0.5 µg/mL.
A certificate that names the salt form but reports no counterion content has given you the qualitative fact and withheld the quantitative one, and the quantitative one is what determines both the true peptide mass and the assay confound.
Where the Impurities Come From
Every impurity on a research certificate traces back to the way the peptide was built. Fmoc solid-phase synthesis builds the peptide from the C-terminus toward the N-terminus on a resin bead, repeating two steps: piperidine removes the Fmoc protecting group, then the next protected amino acid is activated and coupled. The intermediates are never purified between cycles, so every incomplete step is carried forward into every subsequent cycle.
Thermo Fisher states the consequence: "With each coupling cycle, a small number of coupling reactions on individual peptides in the reaction mixture fail, resulting in an increasing concentration of truncated peptides (deletions)."[19]
This compounds geometrically. At 99% coupling efficiency, a 30-residue peptide has a maximum theoretical crude purity of 0.9929, about 74.7%. At 99.5% it is about 86.5%. That arithmetic is mine, derived from the stated mechanism rather than quoted, and it is illustrative rather than a measurement. It explains why longer peptides cost more and why crude material always needs purification.
| Impurity class | Where it comes from | Mass signature |
|---|---|---|
| Deletion sequences | Incomplete coupling or deprotection | Lower by the residue mass. Hydrophobicity close to target, so co-elution risk is high |
| Truncated / capped sequences | Failed chains deliberately acetylated so they cannot resume | Shorter, more separable. Capping is good process control, not sloppiness |
| Insertion sequences | An amino acid coupled twice in one step | Higher by one residue |
| Incomplete deprotection | Fmoc or side-chain protecting groups surviving into product | Higher by the protecting group mass |
| Methionine oxidation | Thioether oxidised to sulfoxide under acidic conditions, i.e. during TFA cleavage | +16 Da |
| Tryptophan alkylation | Pmc or Pbf migration from arginine protecting groups onto the indole ring during TFA deprotection | Variable |
| Deamidation | Asn and Gln via a succinimide intermediate | +0.98 Da, below nominal-mass resolution |
| Aspartimide formation | Asp followed by Gly, Asp, Asn, Gln or Arg; backbone nitrogen attacks the side-chain ester | Zero. Generates four isobaric species (alpha/beta × L/D) from one site |
| Racemisation | Acid-catalysed epimerisation during activation; histidine and cysteine most prone | Zero. D-epimers are exactly isobaric. Only chiral methods see them |
| Aggregation | Peptide-resin self-association, worst in hydrophobic sequences between residues 5 and 21 | Requires SEC-LC, a method absent from essentially every research certificate |
Sources for that table: EMA's synthetic peptides guideline, AAPPTEC's side reactions documentation and Iris Biotech's Fmoc side reactions reference.[7][20][21]
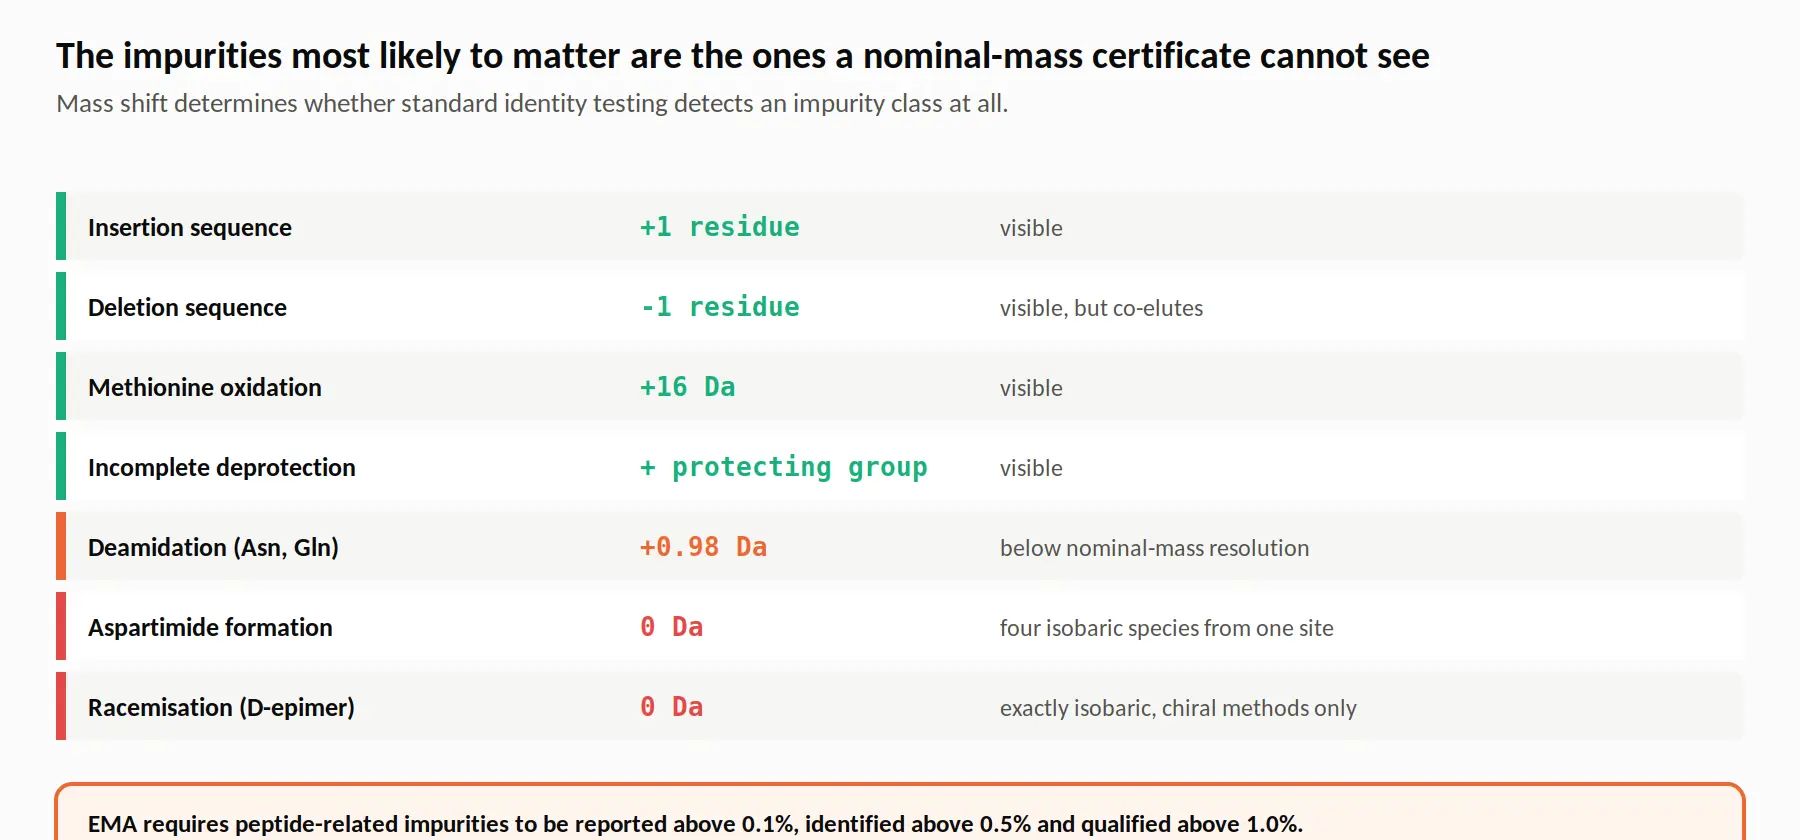
Look at the mass signature column. The three impurity classes most likely to matter biologically, racemisation, aspartimide formation and deamidation, produce mass shifts of zero, zero and 0.98 Da. A nominal-mass certificate cannot see any of them.
EMA's reporting thresholds give you a benchmark to judge a certificate against: "Peptide-related impurities should be reported above 0.1%, identified above 0.5% and qualified above 1.0%."[7] A peptide reported at 99% purity carries about 1% impurities, which under that framework would require identification and possibly qualification. Virtually no research-grade certificate identifies a single impurity by name.
Which impurities a given sequence is prone to follows from the sequence itself: methionine oxidises, Asn-Gly deamidates, Asp-Gly forms aspartimide, cysteine scrambles. Our reference on peptide storage and stability works through the four chemistries and which sequences each one applies to.
What Else Belongs on a Certificate of Analysis
A complete certificate of analysis for a research peptide reports purity, identity, water, counterion, endotoxin where claimed, a lot number and a date. Most research certificates report the first two. The rest are the difference between a document that tells you what is in the vial and one that tells you what the main peak was on the day someone looked.
Water content by Karl Fischer. Coulometric titration is preferred for lyophilisates because there is no solvent blank to account for. Lyophilisates contain very little water and are strongly hygroscopic, which means a vial opened repeatedly gains water. That number does double duty: it is a mass-balance term and a stability predictor.[22]
Endotoxin. FDA recognises four LAL approaches: gel-clot, turbidimetric, colorimetric and chromogenic.[23] One caution about units. The regulatory limit is K/M, expressed per kilogram of body weight for parenteral drugs, with K = 5.0 EU/kg for non-intrathecal. Vendors quoting EU/mg are using a different denominator, and an EU/mg figure is a supplier convention rather than an FDA limit.
Sterility, which is not the same thing. Sterility is absence of viable organisms. Endotoxin is a heat-stable cell wall fragment that survives sterilisation. A sterile-filtered product can still be endotoxin-positive, and the semaglutide study below demonstrates exactly that dissociation. Lyophilised research peptides are generally not sold sterile, and a certificate claiming sterility without naming the method and pharmacopoeial chapter is unsupported.
Amino acid analysis, with its blind spots. Acid hydrolysis destroys tryptophan, so it needs a separate methanesulfonic acid assay with roughly 25% relative standard deviation. Cysteine is not measurable without derivatisation. Asparagine and glutamine are deamidated to their acids during hydrolysis and reported as ASX and GLX.[8]
And composition is not sequence. Amino acid analysis cannot distinguish a correctly ordered peptide from a scrambled one of identical composition. True sequence confirmation needs LC-MS/MS or peptide mapping. Almost no research certificate includes sequencing, which means the identity claim rests on mass plus retention time. That is weaker than most readers assume, and it is worth knowing rather than worth panicking about.
Lot number and date of analysis. These are what make a certificate evidence rather than marketing. Without a lot number it cannot be tied to the vial in your hand, and synthesis impurities are batch-specific. Without a date you cannot know how long degradation has been running.
In-house against third-party testing
The distinction is structural independence, not analytical technique. Both may run the same HPLC method. The formal benchmark is ISO/IEC 17025:2017, which "sets out requirements for the competence, impartiality, and consistent operation of laboratories."[24]
What to check, in priority order: is the testing laboratory named with an address; is it accredited to ISO/IEC 17025 with a verifiable accreditation number; is the sample chain of custody stated; is the analyst or authorising signatory identified.
The weakest link is usually chain of custody, not accreditation. An accredited laboratory reports accurately on the sample it was given. Vendor-submitted samples are not verified to be representative of retail stock. An accredited third-party certificate on a vendor-selected sample is meaningfully better than an in-house certificate, and it is not equivalent to independent testing of purchased retail units, which is what the studies later in this article did.
What peptide purity testing costs, and what you are paying for
I am not going to quote prices, because they change and because the number depends entirely on what is run. The cheapest test is an HPLC purity run at one wavelength, which answers one question. Adding mass spectrometry answers a second. Amino acid analysis, Karl Fischer water and ion chromatography for counterion each add a separate assay, and together they are what turns a purity figure into a peptide content figure. Chiral analysis for D-epimers and size-exclusion chromatography for aggregates are specialist runs that almost nobody commissions on research material.
Two practical points. Independent testing of a retail unit consumes the unit, so the cost of the test includes the vial. And a test is only as informative as the method report that comes with it: a third-party result that arrives as a single number without a chromatogram has the same problem as an in-house certificate that arrives the same way.
Fifteen Things That Make a Certificate Untrustworthy
A certificate fails when it withholds the information needed to check it. The fifteen items below are the ones I look for first, and the third column says why each one takes the document from evidence to decoration.
| # | Red flag | Why it invalidates the document |
|---|---|---|
| 1 | No chromatogram image | The purity figure is an integration result. Without the trace you cannot see baseline placement, peak shoulders indicating co-elution, or whether the gradient ran long enough. A number without its trace is unfalsifiable |
| 2 | Purity with no method stated | Purity depends on wavelength, column, gradient and run time. No method means no meaning |
| 3 | No lot or batch number | Cannot be tied to the vial in hand. Impurities are batch-specific |
| 4 | No date of analysis | Purity degrades continuously after testing. An undated certificate has no interpretable value |
| 5 | No analyst, laboratory or signatory named | No accountable party means no attestation |
| 6 | Missing mass spectrum | Nothing establishes the main peak is the labelled molecule rather than a different peptide |
| 7 | Identical certificates across batches | Independent syntheses produce different impurity profiles. Identical purity to two decimals, identical retention times, or a pixel-identical chromatogram noise pattern indicates a template |
| 8 | No net peptide content | Mass in the vial is unknown. Note this is standard for research grade, so treat it as a gap to price in rather than as misconduct |
| 9 | No counterion identity or content | Determines true peptide mass and assay confounding. Observed range in practice is 18% to 55% |
| 10 | No water content | Missing mass-balance term and stability predictor |
| 11 | Purity stated as ">99%" with no quantification limit | Cannot be distinguished from integration noise |
| 12 | Uniform purity across an entire catalogue | Crude purity falls with chain length. A vendor listing 99% for both a 5-mer and a 39-mer is quoting a marketing figure |
| 13 | Third-party certificate with no accreditation number or chain of custody | An accredited lab reports accurately on the sample it received. Vendor-selected samples are not verified representative |
| 14 | Endotoxin or sterility claimed without method or chapter | Four distinct LAL methods exist. An unqualified "passes" is uninterpretable |
| 15 | Mass reported without stating monoisotopic or average | Produces spurious apparent mismatches, increasingly with molecular size |
None of these fifteen requires laboratory access to check. They are all visible on the document, which is the point: a certificate that fails several of them is telling you what its author did not want examined.
What Independent Testing of Online Products Found
Three published studies bought products from online sellers and tested them, and their results are the strongest evidence in this article, because nobody selected the samples on the vendor's behalf. The short version: semaglutide from rogue sellers ran 7 to 14% pure against 99% advertised, compounded tirzepatide carried a previously unreported adduct in every sample, and six in ten products sold as SARMs did not match their labels.
Semaglutide from no-prescription online sellers
Published in JAMA Network Open in 2024. Test purchases from six online vendors classified as not recommended or rogue, analysed by visual inspection against genuine product, sterility and microbiological testing to European and US Pharmacopoeia guidelines, and LC-MS quantification.[25]
| Finding | Result |
|---|---|
| Products received | 3 of 6. Three vendors ran non-delivery scams, demanding $650 to $1,200 more to "clear customs" |
| Purity | 7% to 14% against 99% advertised, roughly a seven- to fourteen-fold overstatement |
| Semaglutide content | Exceeded the labelled amount by 29% to 39% in every sample. Simultaneously impure and overdosed |
| Endotoxin | 8.95 EU/mg in one sample, while no viable microorganisms were detected in any sample |
| Regulatory history | Two of the websites had previously received FDA warning letters |
That endotoxin finding alongside a clean sterility result is the dissociation described earlier, demonstrated empirically in purchased product.
Compounded tirzepatide with vitamin B12
Published in Expert Opinion on Drug Safety in 2026. Ten samples from compounding pharmacies, medspas and telehealth networks, analysed by UPLC-MS with 1D, 2D and diffusion NMR on laboratory reconstructions.[26] The analysis found a previously unreported tirzepatide-B12 adduct at about 6,138 Da against tirzepatide's 4,810.52 Da. It was present in all samples, at up to 10% of total polypeptide content, and it remained intact under denaturing conditions. Some samples measured as low as 43% of the labelled potency. No studies, in animals, in humans or in the laboratory, have been conducted on the impurity.
This is an impurity class that arises from formulation rather than synthesis, which means it would be invisible to any certificate that predates the compounding step. A certificate is only ever a statement about the material at the moment and in the form it was tested.
Products sold as SARMs
Published in JAMA in 2017. 44 products purchased online and chemically analysed.[27] Only 18 of 44 (41%) had active compound amounts matching the label. 26 of 44 (59%) differed substantially from label. Four products (9%) contained no active compounds at all, and 11 (25%) contained unlisted substances.
Not peptides, but the same distribution channel, the same research-use framing, and the same absence of pre-market verification. It puts a number on the base rate of label inaccuracy in this market: roughly six in ten.
The regulatory backdrop
FDA's Pharmacy Compounding Advisory Committee briefing on BPC-157 contains the clearest regulatory statement of why peptides are analytically harder than small molecules. Peptides "may require more and/or specific analytical in-process and finished product testing for impurities than what is required for small molecules," and peptide-related impurities "are typically similar in structure to the target peptide." FDA identified specific characterisation deficiencies: no bioburden or endotoxin testing documented, no specified impurity characterisation, no aggregation assessment, no residual solvent testing. Aggregation was flagged as an immunogenicity risk factor.[13]
FDA has also issued warning letters to several research peptide sellers, and those letters are public record. One caveat about how they are often cited: they address unapproved-drug and intended-use violations, and none of them contains findings about product purity, sterility or manufacturing controls. They are evidence about marketing, not about quality. Our reference on whether peptides are legal covers what those letters do and do not decide.
How PrymaLab Reports Purity, and How to Read Any Supplier's Certificate
PrymaLab reports HPLC purity and mass spectrometry identity on every lot, with lot numbers and dates of analysis, and the testing process is described at how we test. If you need net peptide content, counterion content or Karl Fischer water for a specific lot and it is not on the certificate you received, ask, and we will tell you whether we have it for that batch rather than quote a catalogue convention.
Reading any supplier's certificate comes down to four questions in order. Is there a chromatogram with its method, so the purity figure can be interpreted? Is there a mass spectrum with the convention stated, so the identity claim can be checked? Is there a lot number and a date, so the document can be tied to the vial and to a moment in time? And is there anything at all about counterion and water, which is what separates a purity number from a peptide content number?
Related references: evaluating peptide suppliers covers sourcing and vendor selection rather than analytical method. Peptide storage and stability covers what happens to a peptide after the certificate was written, and reconstitution covers the four ways material is lost before anyone measures anything. For what a peptide is in the first place, and where the FDA draws the 40-residue line, see what counts as a peptide.
What This Article Does Not Settle
Whether BPC-157 products have ever been independently assayed. There is no published purchase-and-test study of BPC-157. I searched hard for one. A 2026 review confirms no pharmaceutical-grade formulation has been developed or validated, but it presents no product testing data. Anyone implying BPC-157 products have been independently assayed in the literature is overstating what exists.
Whether a good certificate means a good product. Certificate quality and product quality are correlated, not identical. Everything in this article helps you evaluate a document. A well-constructed certificate from a poorly controlled process is possible, and so is the reverse. The only thing that closes that gap is independent testing of purchased retail units, which almost nobody does.
What a research-grade expiry date is based on. FDA's expectation for a peptide drug substance is data from at least three batches over 12 months at long-term storage and six months accelerated. Expiry dates on research peptide certificates are generally conventions, not stability-derived, and should be read that way.
Whether the impurity thresholds quoted here match USP. Most quantitative impurity thresholds cited are EMA's, not USP's. The relevant USP chapter is paywalled and I could not read past the preview, so the 0.1%, 0.5% and 1.0% figures are attributed to EMA.
The glucagon paper's own arithmetic. The mass-balance equation applied to the published inputs leaves a discrepancy of roughly 50 mg/g that the paper does not explain. The headline comparison stands; the worked numbers are the authors' to reconcile.
What is well established: the multiplication rule, the 70 to 90% net peptide content range, the 30-fold tryptophan response at 214 nm, the zero and 0.98 Da mass signatures of the isobaric impurity classes, the 10 to 100 nM trifluoroacetate effect, and the three purchase-and-test studies. Those are checkable in the sources cited.
Frequently Asked Questions
What is the difference between peptide purity and peptide content?
Purity is the fraction of peptide-related material that is the target; content is the fraction of the powder that is peptide at all. The peptide in the vial is the product of the two: 10 mg × 0.80 × 0.99 is 7.92 mg.
What is a typical net peptide content for a research peptide?
70 to 90% for a lyophilised TFA salt per AmbioPharm; AAPPTEC gives 50 to 90%. Arginine-rich peptides sit at the low end, and most research certificates do not report the number.
How is peptide purity tested?
Reversed-phase HPLC at 214 or 220 nm gives the purity figure as main-peak area over total area. Mass spectrometry confirms identity separately, and content needs a third assay such as amino acid analysis.
Why is peptide purity measured at 214 nm?
Because the amide bond absorbs there, so every peptide is visible. The cost is that tryptophan absorbs about 30 times more than a peptide bond, so area percent only approximates mole percent.
Does mass spectrometry prove a peptide is pure?
No. It establishes identity, not quantity, and it cannot see D-epimers (identical mass) or reliably resolve deamidation (+0.98 Da). Purity needs chromatography; a full characterisation needs both, ideally LC-MS.
What is TFA and why is it in my peptide?
Trifluoroacetic acid is used in cleavage and again in HPLC purification, so the peptide comes out as a TFA salt by default. Measured residual TFA runs from about 10% of powder mass to 55% in one commercial lot.
Does residual TFA affect experiments?
Yes. At 10 to 100 nM it suppressed osteoblast and chondrocyte proliferation, and at millimolar levels it stimulated glioma cells. It is uniformly confounding, and salt exchange to hydrochloride or acetate is the standard remedy.
What should a peptide certificate of analysis include?
The chromatogram and its method, a quantification limit, a mass spectrum with the mass convention stated, lot number, date and a named laboratory. Net peptide content, counterion and water are the add-ons that turn it into a complete document.
Which peptide impurities are invisible on a standard COA?
D-epimers (identical mass), aspartimides (identical mass, four species from one site) and deamidation (+0.98 Da). Aggregates need size-exclusion chromatography, which research certificates almost never include.
Does a certificate of analysis expire?
In effect, yes. It describes the material on the day of analysis; oxidation, hydrolysis, deamidation and aggregation continue afterwards, so a 14-month-old purity figure describes a material that no longer exists in that state.
References
- Sigma-Aldrich. Peptide Sample Amount Determination. Definitions of HPLC purity and the content-times-purity rule. Sigma-Aldrich
- AmbioPharm. What Data is Provided on the Certificate of Analysis. Peptide content, water and counterion as optional add-ons on non-GMP certificates. AmbioPharm
- Bachem. Quality Control of Amino Acids and Peptides: A Guide. Definitions of net peptide content and area-percent purity. Bachem
- AAPPTEC. Peptide Quality FAQ. The independence of content and purity, and the worked TFA arithmetic. AAPPTEC
- R&D Systems / Tocris. Peptides Technical Information. The 1.43 mg compensation practice. R&D Systems
- AmbioPharm. What is Peptide Content. Sequence dependence of counterion binding and hygroscopicity. AmbioPharm
- European Medicines Agency. Guideline on the Development and Manufacture of Synthetic Peptides. Assay methods, orthogonality, counterion control, reporting thresholds and the 0.1% quantification limit. EMA
- Texas A&M Protein Chemistry Laboratory. Amino Acid Analysis Assay Description. Hydrolysis conditions and the tryptophan, cysteine and ASX/GLX limitations. Texas A&M
- Purity determination of synthetic glucagon using a mass balance approach. Sci Rep. 2020. The water, TFA and mass-balance figures. Nature
- Waters. Practical Approaches to Peptide Isolation: Method Development Considerations. Column, mobile phase and modifier roles. Waters
- Kuipers BJH, Gruppen H. Prediction of molar extinction coefficients of proteins and peptides using UV absorption of the constituent amino acids at 214 nm. Anal Chem. 2007. PMID 17539659. The 923 M-1cm-1 peptide bond coefficient and side-chain contributions.
- BioPharm International. The Benefits of Combining UHPLC-UV and MS for Peptide Impurity Profiling. The three limits of UV detection. BioPharm International
- FDA. Pharmacy Compounding Advisory Committee Briefing Document, BPC-157. Peptide-related impurities and the characterisation deficiencies identified. FDA
- PolyPeptide. Control Strategies for Synthetic Therapeutic Peptide APIs. Orthogonal methods and the ±1.0 mass unit acceptance criterion. PolyPeptide
- Strupat K. Molecular Weight Determination of Peptides and Proteins by ESI and MALDI. Methods in Enzymology, Vol. 405. Charge-state ladders, deconvolution and mass accuracy by technique. UCSF
- Iris Biotech. Conversion of TFA Salts. The two TFA exposures and the HCl exchange method. Iris Biotech
- Cornish J, Callon KE, et al. Trifluoroacetate, a contaminant in purified proteins, inhibits proliferation of osteoblasts and chondrocytes. Am J Physiol Endocrinol Metab. 1999;277(5):E779. PMID 10567002.
- GenScript. Impact of Counter-ion in Peptide on Studies in Different Research Fields. Residual TFA ranges, the two MOG lots, glioma stimulation and the FTIR band. GenScript
- Thermo Fisher Scientific. Peptide Design. Accumulation of deletion sequences across coupling cycles. Thermo Fisher
- AAPPTEC. Aggregation, Racemization and Side Reactions. AAPPTEC
- Iris Biotech. Common Side Reactions in Fmoc Solid Phase Peptide Synthesis. Iris Biotech
- Sigma-Aldrich. Determination of Water Content in Lyophilisates Using Karl Fischer Titration. Sigma-Aldrich
- FDA. Bacterial Endotoxins/Pyrogens Inspection Technical Guide. The four LAL methods and the K/M limit. FDA
- ISO/IEC 17025:2017. General requirements for the competence of testing and calibration laboratories. ISO
- Ashraf AR, et al. Safety and Risk Assessment of No-Prescription Online Semaglutide Purchases. JAMA Netw Open. 2024. JAMA Network Open
- A novel, widespread impurity in mass-compounded tirzepatide/B12 products. Expert Opin Drug Saf. 2026;25(5). PMID 42010938.
- Van Wagoner RM, Eichner A, et al. Chemical Composition and Labeling of Substances Marketed as Selective Androgen Receptor Modulators and Sold via the Internet. JAMA. 2017;318(20):2004. PMID 29183075.
Analytical figures, regulatory thresholds and study results are taken from the sources cited, current to 13 September 2026. Where a figure could not be verified against a primary source, or where an arithmetic derivation is the author's own, that is stated in the text rather than omitted.
Final disclaimer: This article is an educational reference on the analytical characterisation of synthetic peptides. Compounds supplied by PrymaLab are sold and studied for laboratory research use only and are not approved by any regulatory authority for human or veterinary use. Statements have not been evaluated by the FDA. Nothing here is medical advice, administration guidance, or a treatment claim.
Regulatory guidelines and pharmacopoeial thresholds are described for scientific context only and do not imply that research-grade material meets, or is required to meet, those standards. Always verify the legal status of any research compound in your jurisdiction before purchase or use.